In 1977, during the severe inflation period of the 1970s in the United States, Warren Buffett wrote an extensive article in Fortune magazine, explaining in detail the impact of inflation on the stock market.
In the article, he compared stocks to bonds with a 12% return rate. In an environment where bond interest rates were only 3%-4%, a portion of the interest received automatically reinvested at a 12% return rate, which held significant value.

Consequently, in such an environment, people were willing to reinvest a portion of their earned interest.
However, inflation affects the rate of return. If inflation is low, for example, at 2%, most retained earnings can be converted into real growth in productivity. But if inflation is adjusted to 7%, after deducting the inflation factor, there won’t be much surplus available for investment in real growth.
As a result, many companies sought changes. Public utilities continued to distribute dividends, and some even increased quarterly dividends but required new and existing shareholders to return the money. This resulted in the issuance of new shares.
Buffett said, “This process causes a significant amount of capital to flow to tax authorities and underwriters, and every party appears to be ecstatic (especially the underwriters).”
Furthermore, some public utilities invented more convenient methods. Buffett mentioned the “dividend reinvestment” plan established by AT&T in 1973 as an example, describing it as if it came straight out of the fairytale “Alice in Wonderland.”

Let’s take a journey back and revisit Buffett’s insightful ten-thousand-word essay.
Summary of Warren Buffett’s Insight
- Inflation poses significant risks to bond investors, and stock investors are not immune either.
- The analytical approach to stocks is similar to that of bonds.
- In a low inflation environment, stocks offer a more attractive net asset return compared to bond yields. Investors benefit in three ways in such an environment:
- The company’s net asset return is much higher than the benchmark interest rate.
- Undistributed profits, belonging to investors, remain within the company and provide returns equivalent to the net asset return.
- The valuation of stocks improves as interest rates continue to decline.
- Investors demand a higher return on equity compared to bond returns. However, comprehensive analysis of five methods to enhance the net asset return on stocks reveals that Warren Buffett discovered no significant increase in net asset returns in an inflationary environment.
- Companies with lower leverage levels exhibit better earnings quality than those with higher leverage levels, provided they have the same net asset return.

- Most companies lack the ability to transfer costs, expand, or maintain profit margins during inflationary periods.
- Inflation acts as a shield for value investors, as undervalued stocks offer protection against rising prices.
- Inflation during peacetime is more of a political issue than an economic one. No one can accurately predict inflation rates. However, Buffett believes that high inflation will persist in the coming years.
- Inflation is an invisible tax that erodes the purchasing power of stock investors, even though they hold assets that may appreciate.
- The best way for individuals to mitigate the effects of high inflation is to enhance their bargaining power.
- “Robbing the rich to aid the poor” cannot provide even temporary relief to the impoverished. The correct approach is to direct capital towards modern productivity and boost economic output.
- High inflation increases the cost of corporate capital expenditures, thereby limiting companies’ ability to reward shareholders.
- Governments often intervene in capital flows towards industrial sectors during periods of high inflation to stimulate economic growth.
Stable Returns: Understanding the Average Annual Net Asset Return Rate
In the first 10 years after World War II, up until 1955, the companies comprising the Dow Jones Industrial Average reported an average annual net asset return rate of 12.8% based on year-end net asset values. In the following 10 years, this figure was 10.1%, and in the third decade, it stood at 10.9%.
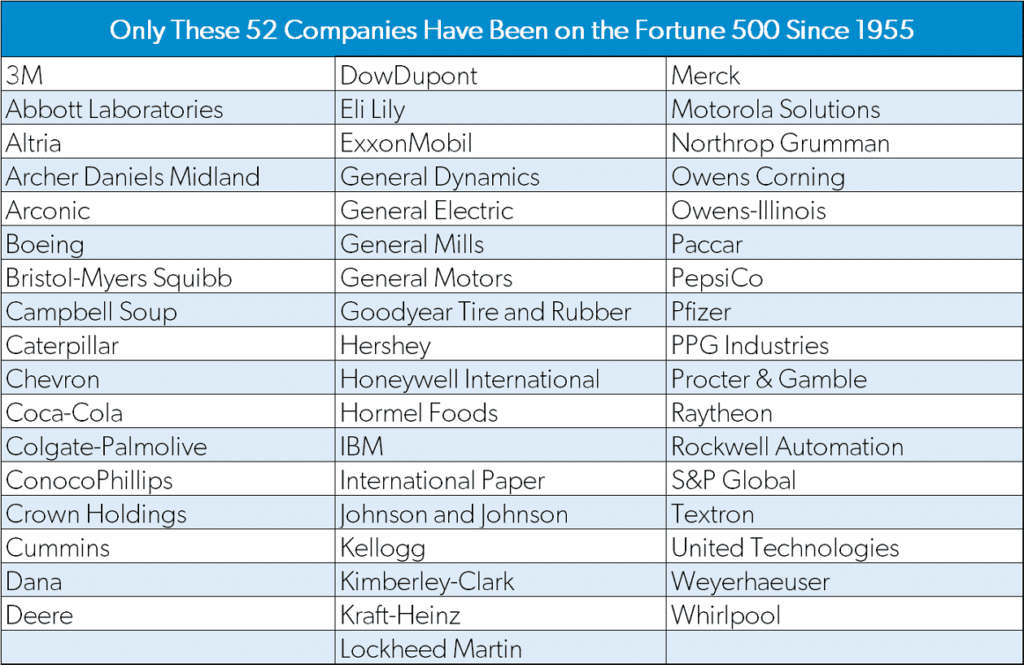
Looking at data from the larger Fortune 500 companies (with a history tracing back to the mid-1950s), the conclusions are quite similar. The 10-year return rate as of 1965 was 11.2%, while it reached 11.8% by 1975.

While there may be some outliers in certain years, such as significantly higher returns (the highest return rate for Fortune 500 companies being 14.1% in 1974) or lower returns (the lowest rate being 9.5% in 1958 and 1970), the average net asset return consistently regresses to the 12% mark over several years.
Even in inflationary years, there is no indication that this figure can significantly surpass the 12% threshold (which holds true even in stable price years).
Now, let’s pause for a moment and consider those unlisted yet productive enterprises. Let’s assume that these companies are acquired based on their net asset values, and in such a scenario, their returns should also be the same 12%.
Due to the stability of returns, it seems reasonable to consider this return as a form of ‘equity bond.’
Of course, in the real world, investors in the stock market are not simply buying and holding. Many investors attempt to outsmart others in order to secure the largest share of company profits.
However, this behavior does not generally increase returns, nor does it have a significant impact on the fluctuations of a company’s net assets. Worse still, this behavior leads to a substantial amount of frictional costs, such as advisory fees and brokerage expenses, thereby reducing the actual portion of returns attributed to investors.
If we also consider the active options market, which is a gambling market that adds no value to American corporate productivity but requires the participation of many, the frictional costs are even higher.

Lifelong Investment and Returns: Understanding the Differences Between Stocks and Bonds
In the real world, it’s a well-known fact that stock investors usually can’t purchase stocks based on their net asset value. While sometimes they can buy at a price below the net asset value, most of the time they have to buy at a premium to the net asset value, making it challenging to achieve a 12% return.

I’ll discuss the relationship between stocks and bonds later, but for now, let’s focus on the topic at hand. As the inflation rate rises, the return on net assets doesn’t necessarily increase.
In fact, for investors who purchase stocks to obtain fixed returns, they are not much different from investors who buy bonds.
Of course, there are some obvious differences between stocks and bonds in terms of form. Firstly, bonds have a maturity date, and although it requires a long wait, bondholders will eventually reach the day when they can choose new contract terms.
If the current or future inflation rate doesn’t make their existing bonds satisfactory and the bond interest rate remains unchanged, they can refuse to continue. Such behavior has occurred in recent years.


On the other hand, stocks are lifelong investments with no expiration date. Regardless of the profitability of a U.S. company, stock investors must stick with the company. If a U.S. company is destined to earn only 12%, stock investors must learn to adapt to this level of return.
As a whole, stock investors cannot exit or renegotiate midway. Consequently, their entrusted amounts keep increasing. While a specific company may be sold, liquidated, or repurchase its own stocks, the issuance of new stocks and retained earnings ensure continuous growth of equity capital within the company.
In this regard, bonds have an advantage. Bond yields can be renegotiated, while equity bonds cannot. Of course, for a bond with a long-term interest rate of 12%, there is no need for adjustments.


the Unique Features of 70s 12% Equity Bonds
12% equity bonds. These bonds have made quite a splash on Wall Street, appearing like masqueraders among the members of the bond family. However, they have one crucial point of difference.
Typically, bond investors receive their due interest in cash upon maturity, which they can then reinvest as they see fit. However, our equity bond investors have a different experience. A portion of their equity interest is retained by the company and reinvested at the prevailing rate of return.


In other words, from the company’s perspective, while a 12% interest rate is offered annually, a portion is distributed as dividends, and the remaining amount is reinvested within the company to continue earning a 12% return.
The Golden Era of Investing:
Investing in stocks can be both beneficial and risky, depending on the relative attractiveness of a 12% return rate.During the 1950s and early 1960s, it was an incredibly wonderful time for investors due to the automatic reinvestment of a portion of interest at a 12% yield, contrasting with the low bond rates of 3%-4%.


However, it’s important to note that investors couldn’t automatically obtain the full 12% return after investing their capital. This was because stock prices significantly exceeded their net asset value, making it impossible to capture the entire return.
Nonetheless, investors could still enjoy the 12% interest brought by retained earnings.
The Value of Retained Earnings
Retained earnings allowed investors to purchase a portion of the company based on its net asset value, even though the price paid was considerably higher in the prevailing economic environment.
In such circumstances, investors were naturally inclined to avoid cash dividends and celebrate the retention of profits. The more money available for reinvestment at a 12% rate, the more valuable this investment privilege became, leading investors to be willing to pay a higher price for it.


Differential Pricing and Investment Opportunities
During the early 1960s, investors willingly paid a high premium for power stocks located in economically growing regions, knowing that these companies had the capability to reinvest a significant portion of their earnings.
On the other hand, utility stocks forced by operating conditions to distribute large amounts of cash had relatively lower valuations.
If, during the same period, a long-term bond with an exceptional 12% yield, non-redeemable before maturity, existed, it would undoubtedly sell at a price significantly higher than its face value.


Unusual Characteristics and Premiums
Furthermore, if this bond allowed the purchase of additional bonds of the same type using most of the interest payments at face value, those additional bonds would command higher premiums upon issuance. Essentially, growth stocks retaining the majority of profits represented such securities.
Investor Sentiment and the Price to Pay
With ordinary interest rates around 4% and a 12% return on additional equity capital, investors would undoubtedly be ecstatic. However, they also had to pay a premium for this “euphoria.”
The Rise and Fall of Stock Investments
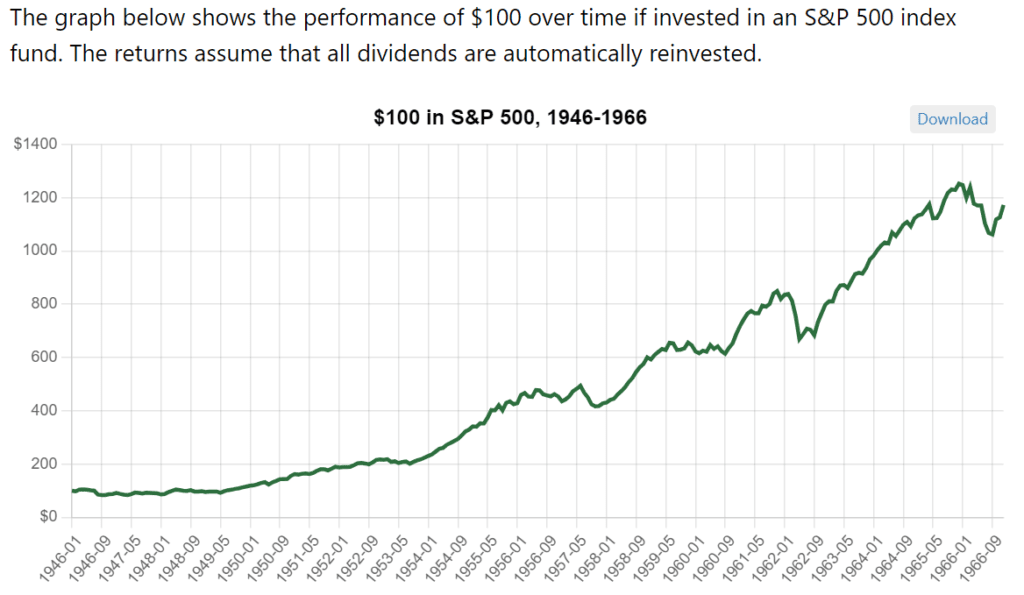
Looking back at history, stock investors can consider themselves to have enjoyed extraordinary benefits from 1946 to 1966.

- They benefited from companies’ net asset returns far exceeding the benchmark interest rates.
- They were able to reinvest their returns at higher rates that were not available elsewhere.
- Due to the increasing recognition of the first two points, companies’ equity capital received escalating praise.
The third point brought the additional advantage that investors received extra rewards on top of the 12% basic interest or what is known as the company’s equity capital earnings. The average price-to-book ratio of the Dow Jones Industrial Average increased from 1.33 times the net value in 1946 to 2.2 times in 1966. This rising PB ratio temporarily exceeded the inherent profit-generating capacity of the invested companies, resulting in higher returns for investors.
In the mid-1960s, numerous large investment institutions finally discovered this earthly paradise. However, just as these financial elephants stampeded into the equity market, we coincidentally entered an era of accelerating inflation and high interest rates.


Naturally, the rising prices started to turn around, with increasing interest rates mercilessly eroding the value of all interest-fixed investment instruments. As the long-term bond rates rose (ultimately reaching 10%), the privileges of the 12% equity return and reinvestment also began to be disregarded.
People naturally believed that stocks carried higher risks than bonds, even though the returns from equity bonds were relatively fixed for a certain period, they still fluctuated in different years.
Although the annual variations in these numbers were erroneous, they significantly influenced investors’ perception of these figures. The relative risk of stocks lies in their indefinite maturity date (even enthusiastic brokers wouldn’t market a 100-year bond, if they had one, as a “safe investment”).


Due to this additional risk, investors instinctively believed that equity returns had to surpass bond returns to be satisfactory. For example, a 12% equity return compared to a 10% bond interest, assuming they were issued by the same company, this proportionate relationship was not satisfying. As the interest rate differential continued to narrow, equity investors began looking for an exit strategy.
It’s imaginable that they couldn’t all exit together. The entirety of what they obtained could only be more price volatility, enormous friction costs, and constantly refreshed undervaluation, reflecting the reduced attractiveness of 12% equity bonds under inflationary conditions.
Over the past decade, after experiencing successive blows, bond investors have come to realize that no high-interest rates are secure, whether it’s 6%, 8%, or even 10% interest bonds, their prices can still collapse. Stock investors, as they have not fully realized that they hold a form of “bond” themselves, continue to receive an education.
5 Methods to Improve Profitability: Boosting Return on Assets
Is the fixed 12% yield on this equity bond destined to remain unchanged? Is there a law that prohibits companies from increasing their return on net assets to counter the seemingly ever-rising inflation rate?
Of course, such a law does not exist. However, on the other hand, the profitability of American companies cannot be determined by expectations and government directives.
To increase the return on net assets, companies must accomplish one of the following:
- Improve turnover rate, such as adopting sales-to-total-assets turnover ratio within the company.
- Less expensive leverage.
- More leverage.
- Lower income taxes.
- Higher sales profit margin.
These are the only ways to enhance the return on net assets.


Now let’s explore what can be done.
Let’s start with turnover rate. When conducting this examination, there are three types of assets we need to scrutinize: accounts receivable, inventory, and fixed assets represented by factory equipment.
Accounts receivable should rise proportionately with sales. Regardless of whether the sales growth is due to an increase in the quantity of products sold or inflation, there is hardly any room for improvement.
As for inventory, the situation is not as straightforward. In the long term, the quantity of inventory will vary with changes in sales. However, in the short term, the actual turnover rate may fluctuate due to certain specific reasons like cost expectations or bottle-necks.


During periods of inflation, adopting the “last in, first out” (LIFO) inventory valuation method can help increase turnover rate on financial statements.
When sales increase due to inflation, companies using the LIFO inventory method (if the quantity of products sold remains the same) can maintain the existing level of turnover rate or increase it (if the quantity of products sold increases) along with the rise in sales. In any case, the turnover rate will improve.
In the early 1970s, despite the fact that the LIFO accounting principle reduced profitability and tax rates on company financial statements, many companies still announced the adoption of this principle.
Currently, this trend shows signs of slowing down. However, those companies that have already adopted this principle and those that are about to adopt it are sufficient to further enhance the inventory turnover rate on financial statements.


The Impact of Inflation on Asset Turnover and Returns
Inflation can have significant effects on fixed assets and their turnover rates. Assuming equal impact on all products, any increase in the inflation rate will immediately raise the turnover rate.
This is because sales figures can quickly reflect the new price levels, while adjustments to fixed asset accounts are gradual. For example, equipment can be purchased at the new price only after existing equipment is phased out.


It is evident that the slower the company’s equipment renewal process, the faster the turnover rate improves. This trend will only stop once the renewal cycle is complete. Assuming a constant inflation rate, sales and fixed assets will grow at the pace of inflation.
To summarize, the benefits of inflation are reflected in the turnover rate. Some improvements become certain due to the adoption of the “last in, first out” principle (if accelerated inflation occurs).
It is possible to gain some additional benefits if the sales growth rate exceeds the speed of fixed asset renewal. However, overall returns tend to be mediocre, and these returns are insufficient to significantly enhance the return on equity capital.
Over a ten-year period until 1975, despite overall inflation continuously accelerating, the turnover rate for Fortune 500 companies increased only from 1.18 to 1.29, thanks to the promotion and use of the last in, first out principle.
Cheaper leverage? Impossible. High inflation rates will only make borrowing more expensive. Rapidly rising inflation rates create a greater need for capital, and due to lenders’ increasing distrust in long-term contracts, they begin demanding more.


Even if interest rates no longer rise further, leverage inevitably becomes more expensive when debt is renewed because the current cost of borrowing is much higher than the old debts on the company’s books. This debt renewal occurs on the maturity dates of existing debts. In conclusion, changes in the future cost of leverage will have a negative impact on return on net assets.
More leverage? U.S. companies have already exhausted too many (if not all) available “leverage-type” bullets.
To support this argument, we can find additional statistical data among the Fortune 500 companies: over a 25-year period until 1975, the percentage of shareholders’ equity to total assets decreased to below 59% from 63%.
In other words, the leverage power borne by each dollar in equity capital has far exceeded the past.
Lessons for Lenders: Impact of Inflation on Financing Needs
Inflation-induced financing demands often follow a golden rule: high-profit companies tend to have better credit ratings and require less debt, while lower-profit companies constantly struggle to meet their financing needs. Lenders have become more aware of this issue compared to a decade ago and now limit significant leverage growth for capital-thirsty businesses.
However, in an inflationary environment, many companies find themselves with no other choice but to increase leverage, regardless of the impact on net asset returns.


Management teams resort to this strategy because they require more capital than ever before to sustain business operations, despite constraints on dividend reductions and limitations on issuing new stocks due to reduced attractiveness caused by inflation.
This behavior slowly resembles that of utility companies, which in the 1960s fiercely debated over fractions of decimal points and, by 1974, were grateful for debt financing at a 12% interest rate.
However, debt incurred at current interest rates contributes less to net asset returns than debt taken on in the early 1960s at 4% interest rates. High-interest debt leads to credit rating downgrades, ultimately increasing future interest costs.


When considering these factors alongside the rising cost of leverage, it is likely that the benefits derived from expanding leverage will be offset.
Moreover, compared to a typical balance sheet, American companies have already built up substantial debts. Many companies bear significant pension liabilities, which will have a tangible impact when their employees retire.
While in the low inflation years of 1955-1956, these pension obligations could be reasonably predicted, today it is impossible to know the ultimate debt level of a company with certainty.
If the average inflation rate in the future is 7%, a 25-year-old employee earning $12,000 per year would need to receive $180,000 annually upon retirement at the age of 65 just to cover the increased cost of living.


Each year, companies’ annual reports feature a magical number that represents the deficit in pension liabilities. If this number is reliable, the company could accumulate the total deficit, add it to the existing pension fund’s assets, and transfer the money to an insurance company for guaranteeing the company’s pension obligations.
Unfortunately, in the real world, finding an insurance company willing to entertain this idea is wishful thinking.
In fact, any financial officer of a US company would back off from issuing such irredeemable bonds tied to cost-of-living increases. However, the US companies themselves hold pension systems that effectively carry a substantial amount of debt similar in nature and magnitude to these “cost-of-living” bonds.
Shareholders should scrutinize the hidden leverage within regular debt, unaccounted debt, or debt associated with inflation-linked pension obligations. The value of a debt-free company generating a 12% return is far greater than that of a highly leveraged company generating the same return while having mortgaged assets.
This indicates that the true value of a 12% return obtained today is significantly diminished compared to twenty years ago.


4 Categories of Stock
Lowering the company’s income tax seems impossible now, as investors holding American stocks actually own what is known as Class D stocks. The A, B, and C stocks represent federal, state, and city income tax rights, respectively.
While these “investors” do not have any claim to the company’s assets, they are entitled to a significant share in the earnings, even if those earnings are generated from the retained earnings of Class D shareholders.
The fascinating aspect of these magical A, B, and C stocks is that the share they receive from the company’s profits can suddenly and substantially increase. Any party involved in the “shared benefits” does not have to unilaterally pay the additional amount, thanks to proposals from Congress, for example, that come from Class A shareholders.


Even more amusingly, any class of “shareholders” can retroactively increase their share in the company’s ownership. This occurred in New York in 1975, where the remaining portion left for shareholders in the traditional sense inevitably decreased whenever Class A, B, or C shareholders desired to increase their share in the company.
Looking ahead, it seems unwise for those controlling the A, B, and C stocks to vote for reducing their own share. Class D shareholders have no choice but to fight to preserve their share in the company.
Bad News from the Federal Trade Commission: Ways to Improve Return on Assets in an Inflationary Environment
Increasing operating profits within the net asset return is the final point to improve income, where some optimists hope to gain returns. It cannot be proven yet that they are wrong, but before sales income becomes pre-tax profit, many demands need to be met, primarily including wages, raw materials, energy, and non-profit taxes.


During inflation, these relatively significant costs are unlikely to decrease.
The latest statistics also do not reinforce people’s confidence in expanding profits in an inflationary environment. The Federal Trade Commission’s quarterly report by the end of 1965 showed that the average pre-tax profit of manufacturing companies accounted for 8.6% of sales. However, in the ten years leading up to the end of 1975, the average profit rate was 8%.
In other words, despite a considerable increase in the inflation rate, the profit rate declined.

If businesses can set their prices based on replacement costs, profits will expand during inflation.
However, the reality is that despite the firm belief of most companies in their market position, they still cannot pass on the costs. The column of replacement costs in their financial statements uniformly shows a significant decline in corporate profits over the past ten years.
While it is true that in major industrial sectors such as oil, steel, and aluminum, there may be oligopolistic power to blame, in other industries, we can only say that the pricing ability of businesses has been greatly constrained.


Now that you have learned all five methods to improve return on assets, based on my analysis, none of them can achieve the goal of improving returns in an inflationary environment. Of course, you may come to a more optimistic conclusion in a similar investigation, but please do not forget that a 12% return rate has been with us for a considerable time.
Continue to read Part 2 of 2 here

