
Why are historical high points in stock prices more meaningful than the highest point? This article explores the importance of averaging in reducing noise and presents various methods to determine stock value. Gain insights into the mechanisms of stock price formation, market style preferences, price fluctuations, and the most relevant historical valuation methods.
Individual Bias and System Noise in Stock Investments
In 2020, blue-chip investments were favored, and everyone wanted to discuss Warren Buffett. In 2021-2022, investments based on market trends took the spotlight. Before every market opening, it became crucial to review recent high-frequency data to make informed buy and sell decisions. However, this year, thematic investments have dominated, and any investment unrelated to a specific theme starts at a disadvantage.
It is worth noting that investing in different styles can be profitable and respectable. The challenge lies in distinguishing between earning money through style and mistaking it for fundamental analysis.
Previously, I believed that style was a type of cognitive bias, a stable deviation from the norm. Making money through this style involves aligning your bias with the market’s bias, moving in the same direction.
On the other hand, noise is the fluctuation between highs and lows, accuracy and inaccuracy in judgments.
Read More

Eliminating System Noise through Averaging
While style deviation can be profitable in the long run, noise will inevitably lead to losses. Therefore, investment decisions should aim to eliminate noise.
One effective method to eliminate noise is through “averaging.” Let me illustrate this with a real-life example:
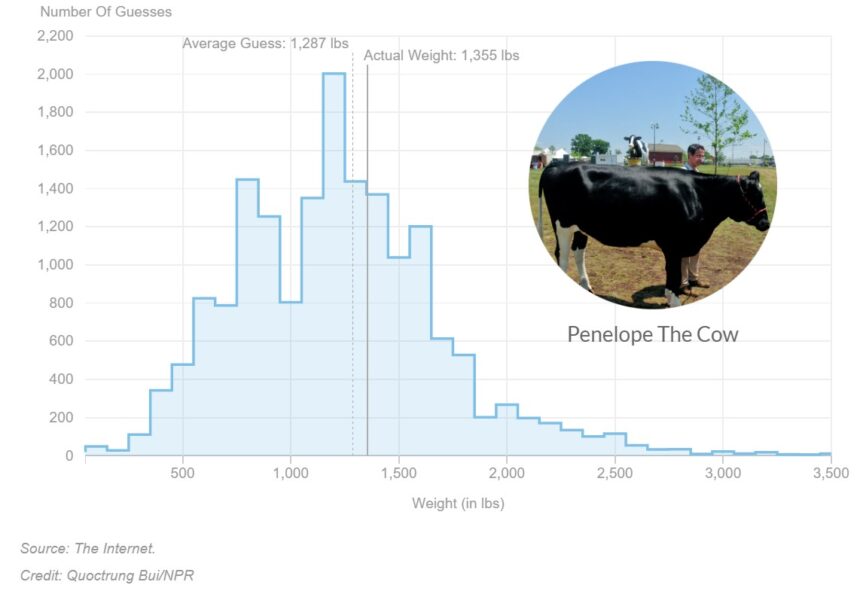
A Story of Statistician Francis Galton
Statistician Galton attended a marketplace where someone had slaughtered a cow. Onlookers were invited to guess the weight of the cow by contributing a small amount of money. The person whose guess was closest to the actual weight would win all the beef.

Galton collected answers from all 787 individuals and discovered that although the weight guesses varied significantly, the average of 1197 pounds was only 0.1% different from the actual weight of 1198 pounds.
The reason for this is that noise deviates in different directions, with positive and negative deviations. If the data set is large enough and the data points are independent (meaning no communication among guessers), averaging can effectively eliminate this noise and reveal the intrinsic value.
This example is often used to demonstrate “market efficiency” and introduces a method for noise elimination.
Consulting with several investment experts and considering their opinions while averaging the agreed-upon prices can significantly reduce noise.
However, many readers have raised different concerns, with the most common question being:
What is the point of averaging the results of investors with different styles? It’s like averaging apples and oranges
Question from readers
This question touches upon the difference between individual and systemic perspectives. For the stock market system, the averaging method not only eliminates noise but also offsets individual biases.
For the system, the deviations (including styles) of all individuals come together and form the system noise.
By applying the averaging method, opposing noises cancel each other out, reinforcing the collective consensus on stock prices.
In the next section, this article will expand the concepts of bias and noise from individuals to the system, discussing the following topics:
- The three mechanisms behind stock price formation
- The four quadrants of market style preferences
- The two deviations causing stock price fluctuations
- The four prices with the highest reference significance
- Historical valuation methods
The Three Mechanisms of Stock Price Formation
01 – Eliminating Noise through Guesswork
Before the advent of scientific valuation methods, investors relied on historical prices, personal intuition, and occasionally dividend information to determine company valuations. This process was more akin to guesswork rather than a structured approach.
Interestingly, when we retrospectively analyze valuations from that era, we find that they were somewhat aligned with fundamental analysis, albeit with greater volatility. This suggests that stock prices are not determined solely by valuation methods but are rather a result of trading activities. In a way, financial markets resemble a “guessing game,” where each participant brings their own biases, contributing to system noise. However, through the process of trading, this noise is gradually eliminated, leading to the formation of actual transaction prices.
The first mechanism behind stock price formation: the “guesswork” process
Fundamental investors play a crucial role as “guesswork facilitators,” ensuring that stock prices broadly reflect a company’s fundamentals. Their analysis helps align stock prices with the underlying economic realities, forming the basis of the Efficient Market Hypothesis and the Random Walk Theory.
However, if you have ever experienced the unpredictability of the market, you might question the notion of market efficiency. The existence of events like the market peak of 6124 points or the unfounded plunge in Hong Kong stocks last October followed by an uncontrolled surge highlights the market’s lack of efficiency.
Stock investing differs significantly from guessing the weight of a bull, as it involves two fundamental differences. These differences give rise to two additional mechanisms that contribute to stock price formation
02 – The Preference Function of Market Styles
Unlike the weight of a bull, which is tangible and objective, stock prices encompass two aspects: reality and expectations.
A company with a net asset value of 50 billion can have a market capitalization of 500 billion. The additional 450 billion represents the future cash flow discounted from expectations.
Stock Price = Reality + Expectations
However, these expectations are not a simple linear extrapolation of reality. They are influenced by a macro preference function, leading to deviations in the market during different periods, ultimately forming what we call “market styles.”
The combination of reality and expectations creates four style quadrants:
Let’s review the market styles of recent years:
Quadrant 1:
Strong Reality and Strong Expectations – During this period, profits rise, investments surge, and all stocks experience an increase in valuation (second half of 2020).
Quadrant 2:
Weak Reality and Strong Expectations – Although economic growth is moderate, the market anticipates a recovery, resulting in higher valuations for stocks with potential (first half of 2019).
Quadrant 3:
Weak Reality and Weak Expectations – Profits are poor, and investors are hesitant, causing an overall undervaluation of stocks (2018, 2022).
Quadrant 4:
Strong Reality and Weak Expectations – Strong economic growth raises concerns, leading the market to favor stocks with strong performance and valuation (2017, second half of 2021).
These four quadrants rotate counterclockwise, forming a standard macroeconomic cycle. Therefore, as a system, the market not only experiences noise but also biases. In the previous article, I concluded that styles are stable cognitive biases that frequently appear:
In 2019, amidst the background of the US-China trade war, all funds with a safety and autonomy focus were given a valuation premium.
During the 2020 bull market, almost all heavily weighted stocks in public funds received valuation premiums.
In 2021, with the global economy flourishing, assets with high prosperity were granted valuation premiums.
In 2022, as the economy continued to decline, the market highly sought after cash flow, resulting in the undervaluation of most assets, including high-growth stocks, except for a few high dividend-oriented ones.
During the first few months of this year, two contrasting sentiments emerged in the market: “Weak recovery is still a recovery” and “Transition from recovery to deflation.” Consequently, the market had two distinct storylines:
The AI sector represented the former, where weak reality and strong expectations led to a focus on performance rather than speculation. On the other hand, the “China Special Valuation” sector represented the latter, where weak reality and weak expectations made only the previously contracted high-dividend industries worth owning.
This is the second mechanism of stock price formation: the preference function of market styles. It determines which stocks the market assigns higher valuation premiums or discounts.
Of course, the formation mechanism of style biases still falls within the framework of traditional economic theory. It is interpretable, exploitable, and somewhat predictable. The unpredictability of stock prices mainly lies in the second difference.
03 – The Formation Mechanisms of Stock Prices
When it comes to stock price formation, there are three key mechanisms to consider. In this article, we will explore the third mechanism, known as the trend coefficient, and how it influences the valuation of different stocks.
Understanding the Impact of Trend Coefficients and Investor Interactions
Investors in the market can be divided into two categories. The first category consists of investors who are like individuals guessing the weight of a bull. They are indifferent to other people’s opinions and only focus on reporting the weight they personally believe to be accurate.
Traditional value investors prioritize a company’s intrinsic value over the fluctuation of stock prices. Their bidding decisions are not influenced by the market. If the market were solely composed of this type of investor, we would observe a style bias without extreme price movements.
However, there is a second category of investors who rely on what Keynes referred to as “beauty contest voting” instead of Buffett’s “weighing machine.” They try to guess what the majority of people consider beautiful rather than selecting based on their own preferences.
It is these investors who continuously buy during an upward trend, leading to an extreme overvaluation in the market, and sell during a downturn, resulting in an extreme undervaluation.
The judgment of these investors regarding market trends can be defined as the “trend coefficient.” This is the third mechanism in stock price formation, which amplifies and regresses the premium or discount in the valuation of each type of stock.
If style bias represents expectations based on reality, trend bias reflects expectations of style bias, or what we commonly refer to as “expectations of expectations.”
High and Low Price in Valuation
In the world of stock market pricing, several mechanisms come into play, driven by noise, biases, and fundamental factors. Let’s summarize the triple mechanism of stock pricing based on noise and biases:
- Fundamental valuation: Investors eliminate individual noise and establish the intrinsic stock price based on fundamental analysis.
- Overlay of style biases: Market style preferences determine which stocks are valued at a premium and which ones are discounted.
- Addition of trend biases: Trend coefficients amplify or regress valuation premiums and discounts.
In summary, the stock price can be represented as:
Stock Price = Intrinsic Value (elimination of noise through fundamental analysis) + Style Bias (based on style preferences) + Trend Bias (influenced by trend coefficients)
As you can see, the fundamental factors of a company are constantly evolving, further combined with changes in style biases and the actions of trend traders. This creates a complex and irregular pattern of stock price fluctuations, resulting in highs and lows. Within these fluctuations, two sets of stock prices hold particular importance.
2 Sets of Importance Stock Prices
01 – Highest & Lowest price of valuation during each upward and downward trend
The first set comprises the highest and lowest points of valuation during each upward and downward trend, rather than the actual stock price.
Different trend investors create biases at any given moment that cannot be eliminated through averaging, as investors tend to have a collective bias towards the same direction.
However, if we observe a longer time frame, these biases form a variety of deviations, becoming noise within the overall temporal system, which can be eliminated through averaging.
In a previous discussion, I introduced the calculation method of odds, precisely through the average of extreme values. Many people believe these extremes to be meaningless noise for stocks, but it is precisely because they are noise that they hold significance.
Of course, averaging extremely optimistic and extremely pessimistic values is a relatively rough method. For more precision, we can explore another set:
02 – Secondary High and Low prices of valuation during each upward and downward trend
The second set comprises the secondary high and low points of valuation during each upward and downward trend.
Fundamental investors are still influenced by style biases. Moreover, both style biases and fundamental factors are simultaneously affected by macroeconomic conditions. For example, in 2020, the consumer sector experienced a widespread surge, even though much of it was driven by a bubble. However, at that time, the fundamentals of the consumer industry were indeed strong, with performance forecasts indicating over 30% growth for the next two years.
While the volatility of style biases may be smaller compared to trend deviations, they are more stable due to fundamental support and often last for more than a year. They not only possess meaningful average values but also contain additional information.
In summary, the significance of these two sets of prices can be understood as follows:
- The highest and lowest points of valuation represent the combination of style biases and trend deviations.
- The secondary high and low points of valuation are primarily influenced by style biases.
Historical Valuation Methods for Assessing Company Value
Long-term and Short-term Reasonable Valuations
Similar to the “historical valuation percentile” method, the historical valuation method considers both long-term and short-term reasonable valuations. It takes into account the valuation limits corresponding to different cycles:
- Short-term reasonable valuation corresponds to the valuation limit observed in the past two to three years, reflecting smaller-scale cycles.
- Long-term reasonable valuation corresponds to the valuation limit observed over a period of three years or more, reflecting larger-scale cycles.
Distinguishing Features
While the historical valuation method shares similarities with the commonly used “historical valuation percentile” approach, there are two key differences worth noting:
- Emphasis on Meaningful Valuation Limits: The method primarily focuses on meaningful valuation limits, which often represent the most influential factors within a specific category.
- Consideration of Fundamental Valuation Changes: Many companies experience significant shifts in their fundamental aspects over time. These changes cannot be compressed into a “historical valuation percentile.” Therefore, it is essential to comprehend the underlying fundamental aspects and market trends corresponding to each valuation limit at the time.
Objective Historical Values vs. Subjective Estimation
Most valuation methods rely on subjective experiences, including the most scientifically sound discounted cash flow method. In contrast, the historical valuation method is purely objective, based on historical data that has been refined to eliminate noise.
While humans are prone to biases and errors, rules and algorithms are not. Consequently, in many instances, an algorithmic model, or even a simple rule, tends to outperform human judgments based on self-perception.
Focusing on Fundamental Analysis and Future Trends
Investors should prioritize analyzing a company’s fundamental aspects and future development trends. The power to determine the high and low valuations associated with the market should be entrusted back to the market itself.
Although history does not always repeat itself, the average values derived from historical data tend to reoccur. By utilizing the historical valuation method, investors gain insights into a company’s intrinsic value and make more objective investment decisions. Remember, understanding fundamental analysis and anticipating future trends are crucial aspects of successful investing.